Stop Guessing Where to Expand. Start Growing with Confidence.
Our platform is the first Expansion Intelligence tool designed for US Daycare and Preschool operators. We turn complex market data into your most profitable expansion decision.
Your next expansion is a $500,000 decision. Are you still relying on guesswork?
Making the right site selection is the single most important factor for success. Yet, most operators are forced to rely on:
Incomplete Data
Traditional tools only show your demand (where people live), but tell you nothing about supply (your competition).
Gut Feeling & Intuition
Relying on feelings in a data-driven world leads to costly mistakes.
Wasted Time & Resources
Months of manual research that still miss the hidden, counter-intuitive opportunities.
Introducing ExpansionPoint AI
From Guesswork to Certainty
We're not just building a better map. We're giving you the answer. For the first time, you can see the real, quantifiable gap between supply and demand in any US market. A positive gap is your blue ocean. A negative gap is a red flag.

We don't just show you data. We show you the empty seats waiting to be filled.
Our Secret Weapon
The Childcare Seat Gap™
The Single Number That Matters Most
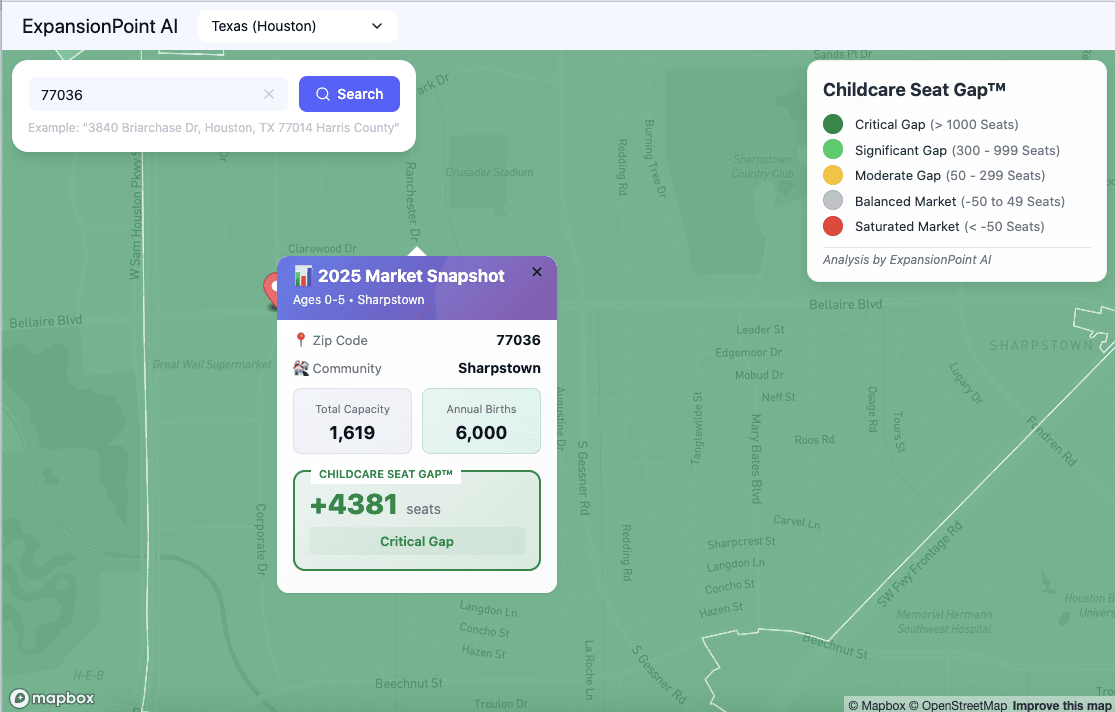
Forget abstract scores and percentages. Our platform calculates the one number you truly need: the exact number of unserved children in any US zip code.
Our method is transparent and powerful: we analyze the total number of children under 5 (the Demand) and subtract the total number of licensed daycare seats (the Supply) to reveal the true Childcare Seat Gap™.
What does this number mean for you?
A positive gap (+512) is a hidden goldmine: a market with a real, quantifiable shortage waiting for you.
A negative gap (-243) is a critical red flag: a saturated market where you must avoid a costly mistake.
This is how we turn a single number into a confident, multi-million dollar expansion strategy.
It's as Easy as 1-2-3
The Simple Path to Value
Step 1: Define Area
Simply enter the city or county you're interested in.
Step 2: Analyze Score
Instantly see your entire target area visualized with our powerful Childcare Seat Gap™ data.
Step 3: Decide with Confidence
Use these clear, actionable insights to make your next $500,000 expansion decision with 100% confidence.
Case Study
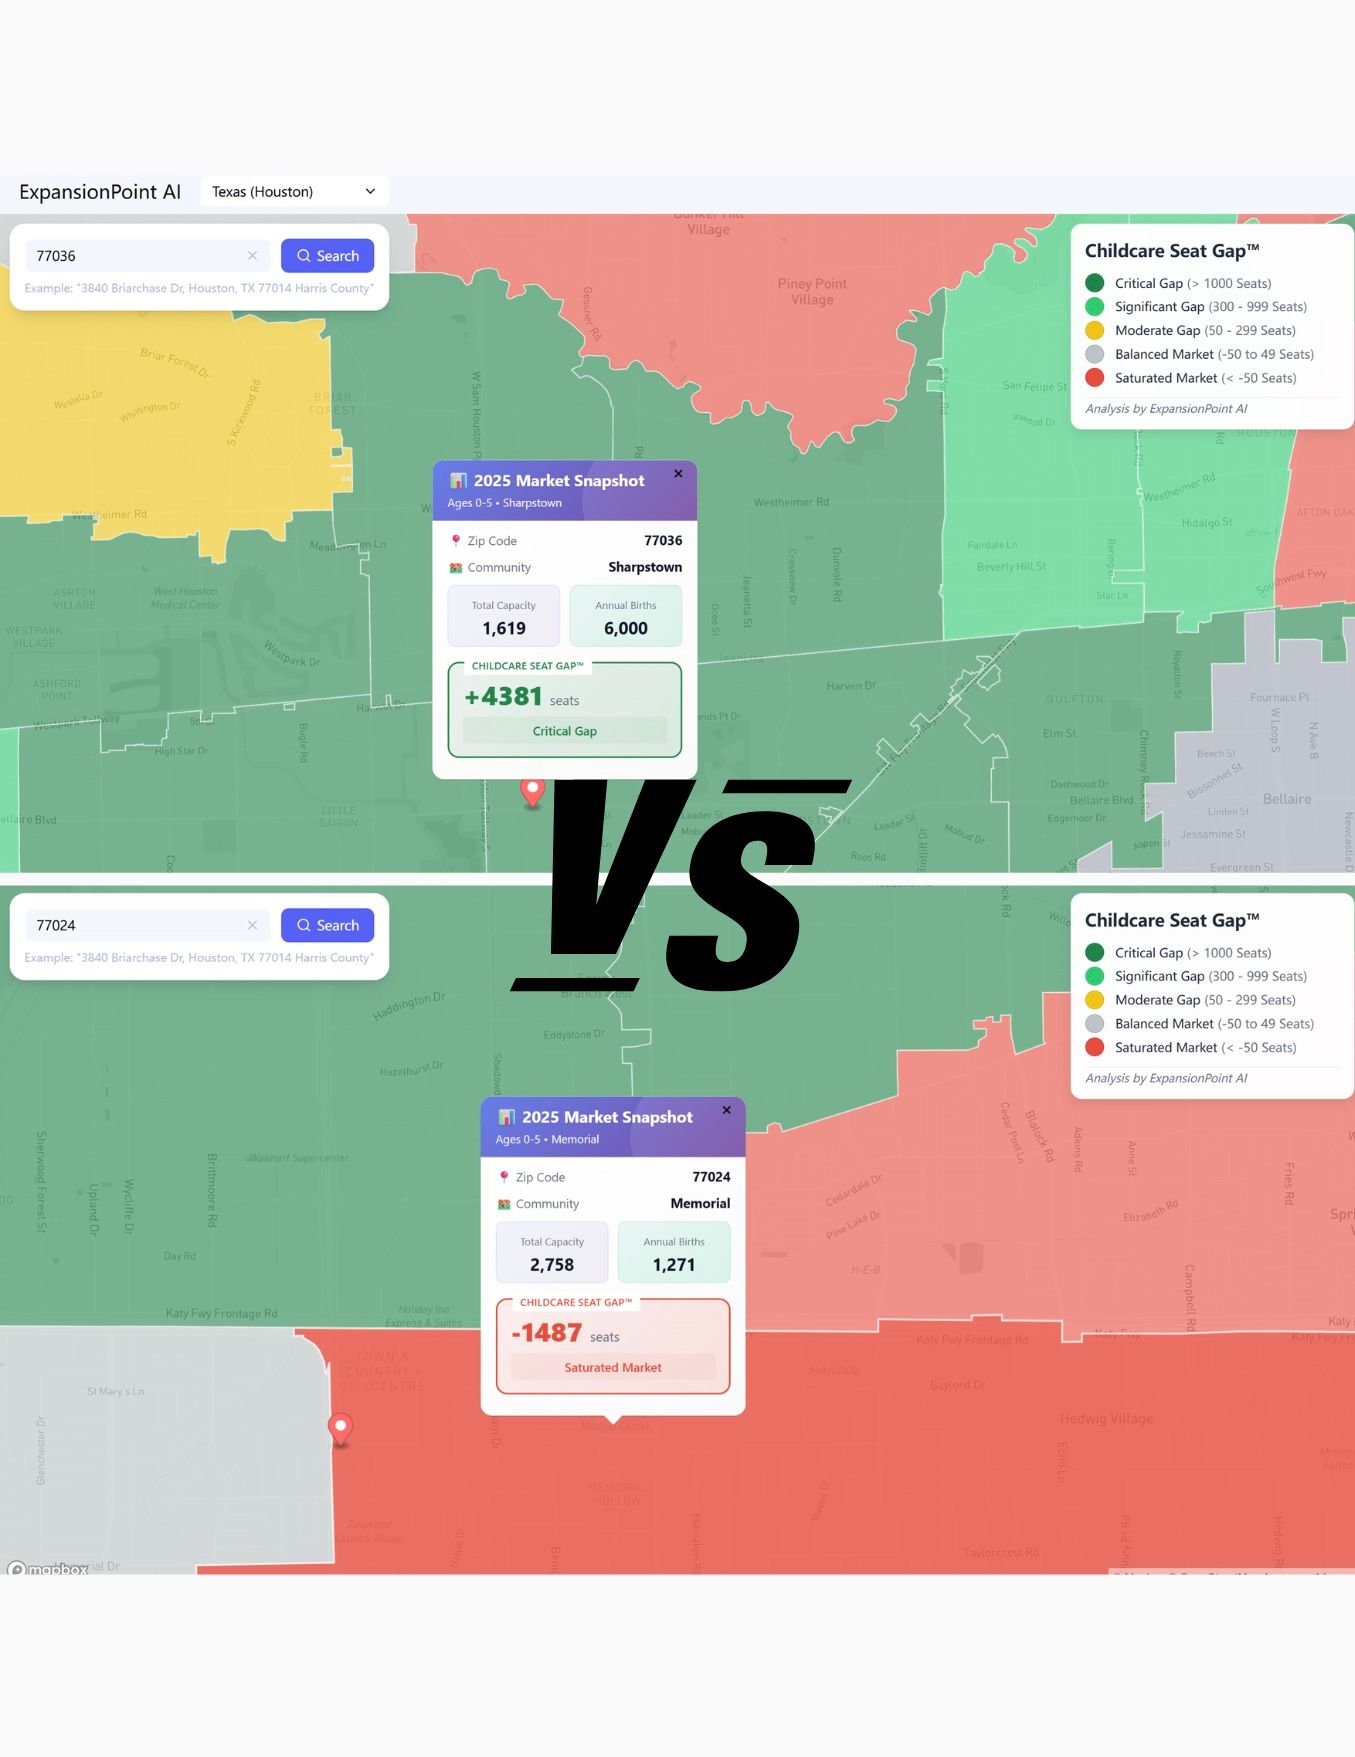
The Obvious Choice vs. The Profitable Choice: A Houston Case Study
Where would you invest $500,000 to open a new daycare in Houston?

Common wisdom points to prestigious neighborhoods like Memorial. Our data, however, reveals a shocking -1,980 Childcare Seat Gap™ in the 77024 zip code—a surplus of nearly 2,000 seats in a saturated market.

The real goldmine? High-demand communities like Sharpstown (77036), which boasts a massive +4,370 Childcare Seat Gap™.

This is the multi-million dollar insight our platform provides. We turn data into your most profitable decision.
The Value for your business
The ROI: Data-Driven Decisions, Real-World Returns.
Our clients use Expansion Point AI to:
Avoid up to $250,000
in potential losses from a single bad location decision.
Achieve an ROI of over 200% within the first two years.
Cut down research time from months to hours.
Be Our Founding Partner
We are currently inviting a limited number of forward-thinking Daycare operators to join our Founding Partner Pilot Program. As a member, you'll get early access to our platform at a significant discount, and work directly with our founders to shape the future of data-driven expansion in the industry. Spots are limited.
Ready to find your blue ocean?
Let us show you the hidden opportunities in your target market.
FAQs
Explore how Expansion Intelligence optimizes daycare operations in USA, enhancing management efficiency and fostering educational excellence.
What exactly is the Childcare Seat Gap™?
The Childcare Seat Gap™ is our proprietary, core metric. It is the actual, calculated number of children under 5 who lack access to a licensed daycare seat in a specific zip code. A positive number (e.g., +500) represents a significant, underserved market. A negative number (e.g., -200) represents a saturated market with a surplus of empty seats. It's the most direct and honest measure of market opportunity.
How is this different from government census or real estate data?
Census and real estate data show you where people live (demand), but they tell you nothing about the existing supply of childcare services. We are the only platform that combines both supply and demand data to calculate the true gap, giving you a complete picture that prevents costly mistakes.
Where does your data come from?
Our platform aggregates data from hundreds of public sources, including state licensing boards and demographic databases, to calculate the Childcare Seat Gap™.
I'm a Daycare operator, not a data analyst. Is this tool easy to use?
Absolutely. Our platform was designed for busy operators. All the complex analysis happens behind the scenes. You get a simple, color-coded map and a clear, absolute number. If you can read a weather forecast, you can use ExpansionPoint AI.