Data-Driven Daycare Market Intelligence & Site Selection
We empower childcare owners and investors with intelligent market mapping and operational capacity optimization. Validate demand before you build, and maximize enrollment after you open.
A daycare center is a $1M+ asset. These are the questions that actually matter.
Operators don’t need more generic demographic data. They need clear answers to a small set of high-stakes decisions.
1. Site / entry decision
- Should I open here?
- Should I acquire this center, or pass?
- What size school can this market realistically support?
2. Operating / enrollment fit
- Can this market support premium tuition?
- Is this enrollment issue internal, or market-driven?
- Which operating model or brand positioning makes sense here?
3. Timing / market risk
- Will future supply compress my margin?
- How can I monitor saturation trends over time?
- Is this market getting stronger, or is it time to exit?
Why These Decisions Are Easy to Misread
Demographics Without Supply
Traditional tools show where families live, but tell you very little about the supply you’re walking into. Without a full view of licensed capacity, competitive density, and the true childcare seat gap, you’re underwriting only half the market risk.
Gut Feeling & Intuition
In a multi-million dollar asset market, relying on “gut feeling” is a high-stakes gamble. In a data-driven world, intuition without verification leads to misaligned expectations, putting your capital at risk.
Unverified Recommendations
Many site decisions inherit bias from third-party incentives, incomplete local knowledge, or deal momentum. Without independent validation, those inputs can push operators toward the wrong site, the wrong price, or the wrong growth thesis.
How ExpansionPoint Answers Them:
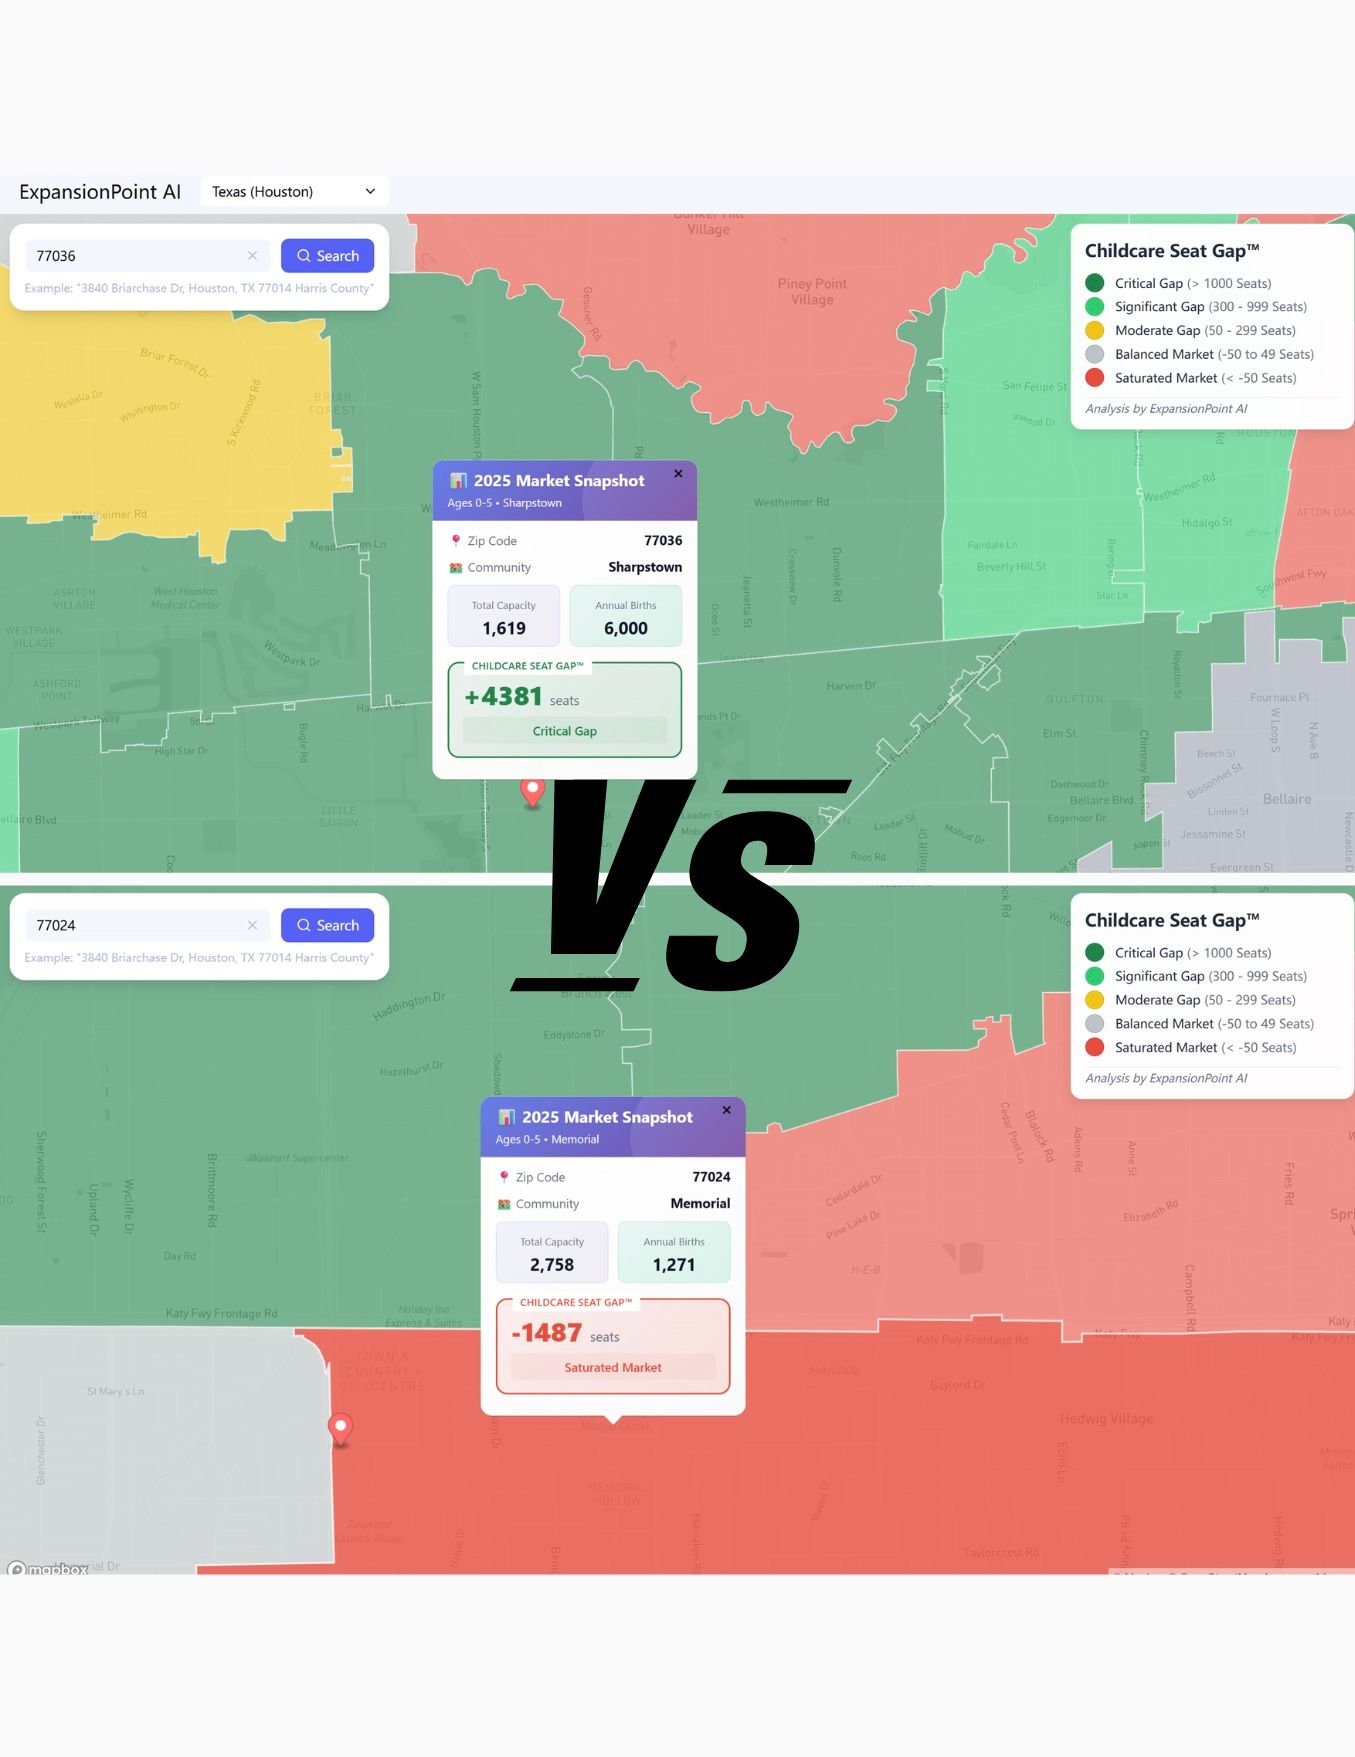
1. Market Saturation & Seat Gap
See whether a market is truly high-demand, or just looks attractive on raw demographic demand.

We analyze licensed capacity, center openings and closures, and supply volatility to estimate the true childcare seat gap in a target trade area.

- Gap visibility: See where unmet demand may still exist.
- Competitive pressure: Understand where supply is expanding, shrinking, or already fully allocated.
- Trend: Evaluate market direction, not just a static snapshot.
2. Addressable Demand by Age and Care Behavior
Move beyond “kids under 5” and estimate the families who are actually likely to use paid childcare.

We segment demand by age group and adjust for local care behavior, including nanny usage and stay-at-home parent patterns, to better estimate true capturable demand.

- Age-level demand: Break demand into infants, toddlers, and preschool.
- Care behavior adjustment: Avoid overstating demand in markets where private care substitutes are common.
- Demand calibration: Turn raw child counts into a more realistic view of demand at your tuition level.

3. Micro-Location, Wealth & Commuter Fit
A daycare site is not defined by ZIP-code averages alone. We analyze hyper-local household wealth, traffic access, and employment inflow to understand whether a location is both financially supportable and operationally convenient for working parents.

- Wealth visibility: Identify whether nearby households can realistically support your tuition model.
- Commuter access: See how traffic corridors and daily routes affect site convenience for working parents.
- Employment inflow: Understand whether nearby job centers may expand demand beyond the immediate neighborhood.

4. Capacity & Pricing Stress-Test
Test whether the market can support your planned school size, tuition strategy, and financial expectations.

We use site-level market indicators to evaluate whether a location is better suited for a smaller format, a larger campus, or a more premium pricing strategy.

- Capacity fit: Evaluate whether the market supports a smaller footprint or a larger-scale center.
- Pricing fit: Test whether local demand can realistically support your tuition model.
- Financial viability: Pressure-test whether revenue and margin expectations are plausible before capital is committed.

5. Future Development & Demand Signals
A site decision should reflect where demand and competition are heading, not just where they stand today.

We track residential development, zoning activity, and permit signals to identify where future household growth or new supply may change the market over time.

- Forward-looking demand: See where future household growth may support enrollment.
- Supply watch: Monitor where new competitive supply could emerge.
- Timing insight: Understand whether the market is strengthening, peaking, or becoming more competitive.

Use Case

For Daycare Owners
Used to assess the performance of multiple locations, identify areas for improvement, and evaluate expansion opportunities based on market data. Flags sites requiring deeper review before committing to further investments.

For Real Estate Developers/Brokers
Brokers use this snapshot to support pricing conversations and reduce friction. Specifically, when buyers hesitate on a location or lenders demand market depth, we provide a third-party market report to restore confidence and keep the deal moving.

For Franchisors / Expansion Managers
Applied as a standardized data input to support internal site screening and expansion discussions across multiple candidate locations.
Tell us about the site
Send the ZIP code, address, or whatever you know so far.
We’ll prepare a site-specific review focused on demand, supply, pricing fit, and market risk.
Texas Daycare Investment Intelligence
Risk calibration and underwriting frameworks for daycare owners and brokers.
FAQs
Is this a go/no-go recommendation?
No — but it sharpens it. We highlight where the market supports your model — and where it doesn’t — so you can move forward (or pivot) with clarity.
What makes this different from generic market reports?
Generic reports describe markets broadly.
This report focuses on site-level supply, demand behavior, and forward signals that may not be visible in high-level data.
How accurate is the site-level data?
Data is compiled from verified public and commercial sources and reviewed before delivery.
It reflects conditions available at the time of analysis and is not a guarantee of future performance.
Can this site analysis help me choose where to expand?
Expansion decisions usually happen in two stages: market opportunity discovery and site-level risk validation.
This analysis focuses on the second stage—when capital commitment begins.
Operators often use broader market intelligence to identify target areas, then apply this audit to pressure-test individual sites before signing leases or acquiring land.
This report does not replace market exploration. It provides site-level risk visibility when decisions become irreversible.
Who typically uses this?
This report is commonly used by brokers, multi-site operators, franchisees, and investors evaluating a specific daycare site with a $1M+ capital commitment.
It is most often referenced during lease negotiations, acquisition review, or internal investment discussions where clearer risk visibility is required.