Daycare Acquisition in Texas: A Real Due Diligence Breakdown of a $2-8M Deal
As discussed in our previous analysis, "Is Buying a Daycare in Texas a Good Investment," macro-level state growth is only the beginning of the story. Today, we use Waxahachie as a practical example. We will see exactly how this investment playbook works in reality.
Consider an investor evaluating a $2.8M acquisition of an existing 200-capacity franchise center in Waxahachie. The asking price seems fair on paper, but due diligence requires moving beyond the seller's P&L to validate the underlying market demand.
Whether you are buying an existing center or signing a long-term commercial lease, the underwriting logic remains the same. A structured approach breaks down the market and the competition step by step. It reduces uncertainty. It allows unmeasurable variables to be measured through directional underwriting frameworks.

Step 1: Catchment Area & Supply Analysis
A professional daycare acquisition in Texas begins with an external analysis of the operational geography. You are not just buying a P&L; you are buying the exclusive right to capture a specific 10-minute drive-time zone.
We use the target site in Waxahachie to define the structural health of the market. A 10-minute drive catchment around 1920 US-287 BUS in Waxahachie captures three key overlapping ZIP codes. These are 75165, 75167, and 76065.
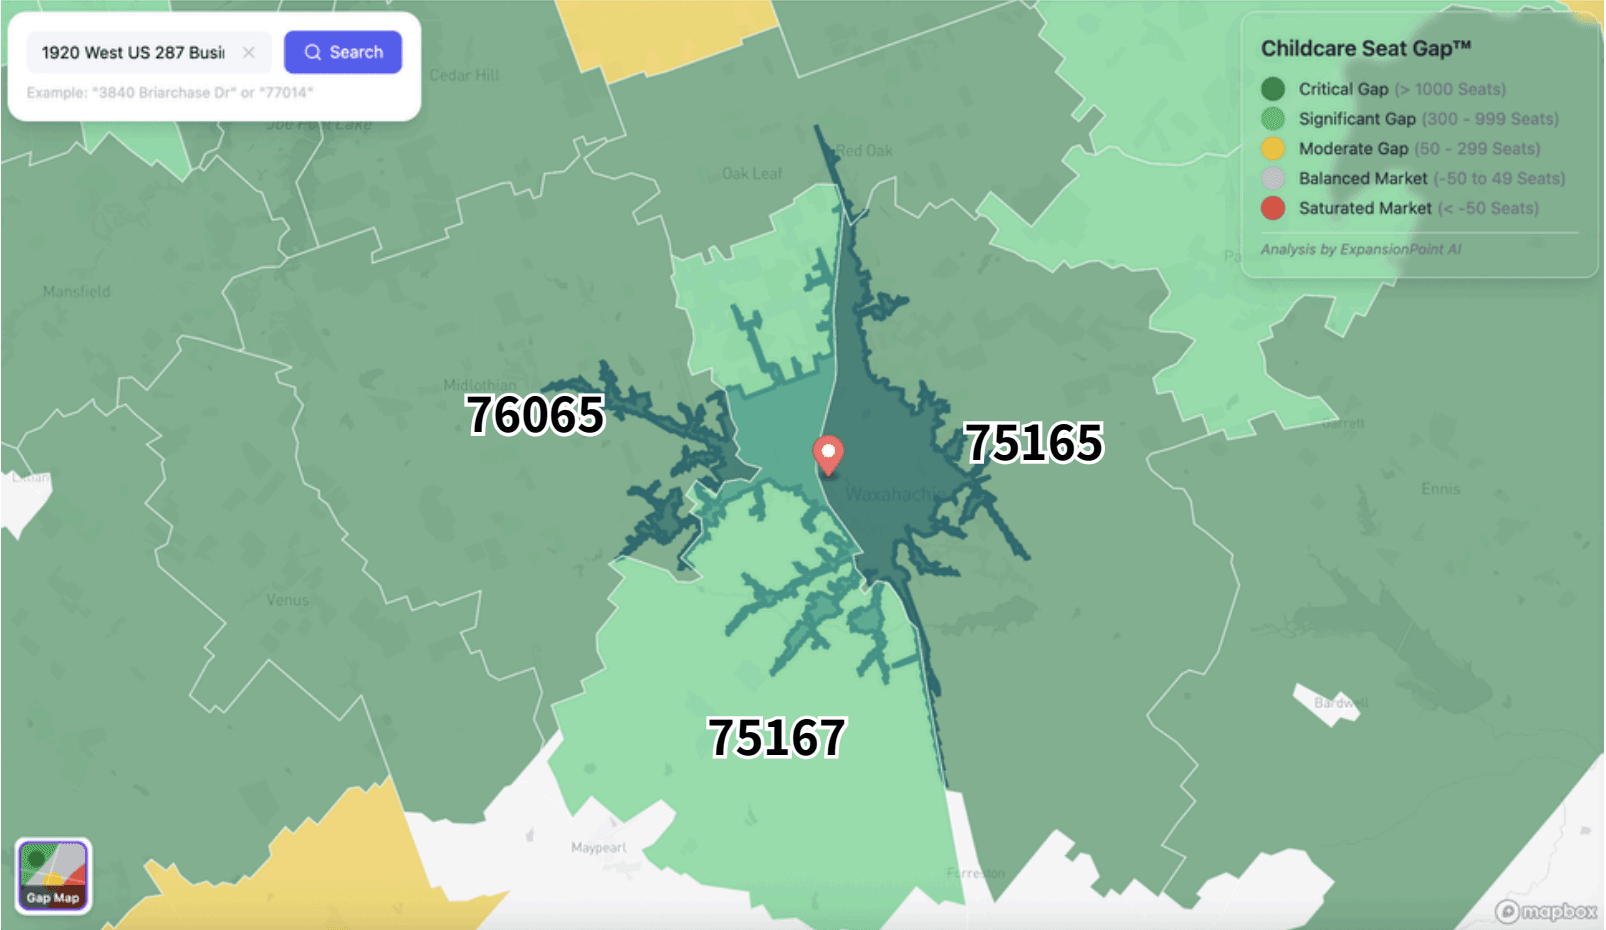
While a drive-time polygon defines behavioral traffic, ZIP-level data serves as our first-pass structural proxy to scan for market health. Reviewing the macro variables provides an immediate overview. This high-level visibility reveals the critical seat gaps. It also exposes areas facing potential oversupply. Operators use this data to direct future marketing resources.
| ZIP Code | City Name | Total Families | KIds under 5 | Income > $100k | Licensed Capacity |
| 75165 | Waxahachie | 13,073 | 4,416 | 41.7% | 1,549 Seats |
| 75167 | Waxahachie | 3,499 | 813 | 56.7% | 51 Seats |
| 76065 | Waxahachie | 12,435 | 3,559 | 61.2% | 2,164 Seats |
Initial data reveals a structural divergence. ZIP 75167 presents as a high-income micro-pocket with virtually zero institutional supply (51 seats). Conversely, ZIP 76065 shows heavier supply density relative to its population base.
Total population is only the first layer. A precise daycare business for sale Texas evaluation requires segmenting that population into specific age groups. Understanding the exact distribution of infants, toddlers, and preschoolers is critical. It lays the groundwork for optimizing capacity planning.
| ZIP Code | Infant Est. | Toddler Est. | Preschooler Est. |
| 75165 | 1,505 | 1,402 | 1,509 |
| 75167 | 256 | 253 | 303 |
| 76065 | 1,243 | 1,137 | 1,179 |
This foundational data dictates classroom allocation and informs early hiring models.
Step 2: Demand Stressing Test and Addressable Yield
A comprehensive daycare feasibility study applies a demand stress test to the raw numbers. Assuming every child requires institutional care often leads to an exaggerated enrollment projection. An effective model filters the raw demand through workforce participation rates. It also accounts for private nanny substitution.
The Nanny Filter acts as a conservative pressure test on the demand side. The resulting Addressable Seat Gap provides a more realistic baseline of total unmet demand.
| ZIP Code | Market Saturation | Childcare Seat Gap | Addressable Seat Gap |
| 75165 | 34.4% | 2,867 Seats | 977 Seats |
| 75167 | 6.4% | 762 Seats | 402 Seats |
| 76065 | 62.7% | 1,395 Seats | -286 Seats (Oversupplied) |
This data forces a strategic pivot. ZIP 76065 holds a large population. However, its negative addressable gap indicates saturation. Conversely, 75165 and 75167 display genuine addressable shortages.
It is critical to note that an addressable gap of +402 seats does not guarantee enrollment. Capturing this demand assumes the new center achieves pricing alignment and competitive differentiation. Filtering the raw census data provides a calibrated, actionable demand signal.
Step 3: High-End Positioning & Competitor Distribution
With demand calibrated, the next question becomes positioning.
Positioning a premium daycare center requires matching tuition rates with local affordability. A 200-capacity facility charging $1,400 per month requires specific demographics. Standard affordability metrics dictate target households must earn over $100,000 annually. Filtering the market for this High-End Net Demand reveals the qualified base.
- 75165: 1,051 Children (High-End Net Demand >$100k)
- 75167: 256 Children
- 76065: 1,149 Children
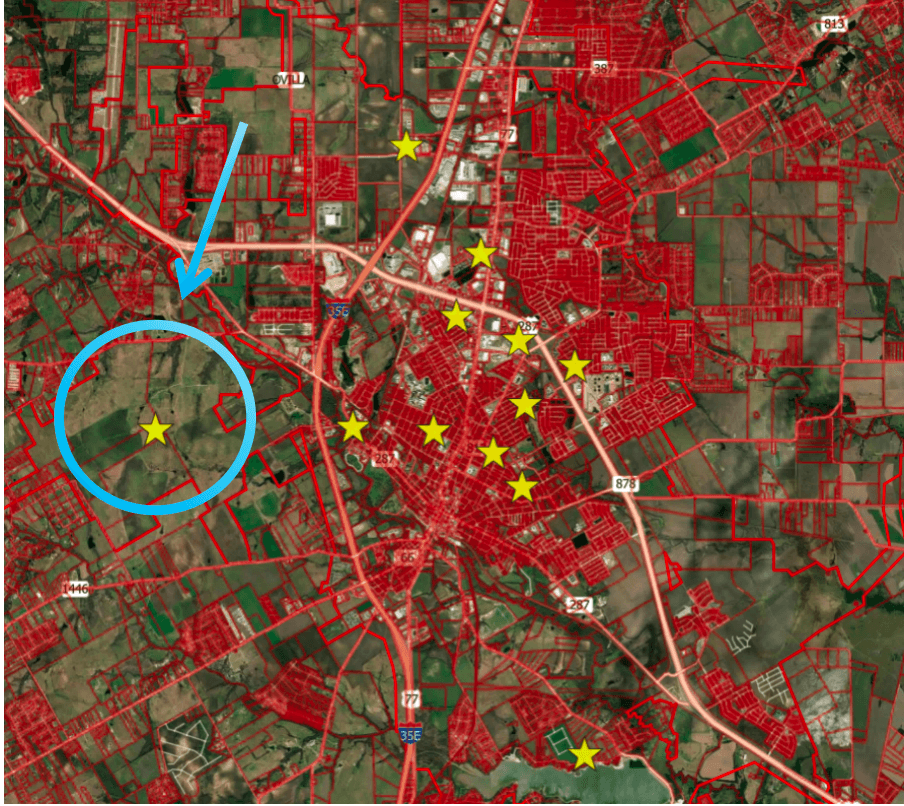
Capturing this demographic requires strategically navigating the existing competitors. An analysis of several key large-format operators in the catchment area reveals the competitive density.
| Competitor Name | Capacity | Hours | Program Type | Rating |
| EverStar Academy | 238 | 6:00 AM - 6:30 PM | Infant-School Age | 2-Star |
| Fire House Kids | 170 | 6:00 AM - 6:00 PM | Infant-School Age | 3-Star |
| Ark of Friendship | 170 | 8:30 AM - 2:30 PM | Short Day | Unrated |
| Growing in Grace | 159 | 7:00 AM - 5:45 PM | Infant-School Age | Unrated |
Knowing total competitor capacity is necessary. Estimating their age-segment distribution unlocks operational efficiency. Expanding owners use this existing age-specific seat gap to adjust classroom blueprints. A market might show an oversupply of preschool seats alongside an infant care shortage. Operators redesign ratios to maximize labor efficiency based on this exact signal.
Understanding age-specific competitor distribution is the core of a successful market capture strategy.
Step 4: The Future Pipeline
Current market gaps are temporary. Evaluating new daycare permits Texas highlights the future pipeline. Large-scale residential planning provides the demand runway.
Tracking these developments protects capital. It prevents an operator from opening a new center just as a major competitor floods the market.
Step 5: Acquisition Underwriting & Financial Review
Why did we spend four steps analyzing Waxahachie’s seat gaps? Because market scarcity justifies the purchase multiple.
To see how these market signals translate into an actual price, let’s examine a $4.5M case study in a similar high-growth Texas corridor. This analysis shows how to isolate the value of the "dirt" (real estate) from the operational cash flow.
| Metric | Case Study |
| Asking Price | $4,500,000 |
| Asset Type | Business + Real Estate (Owned) |
| Lot Size | 2.1 Acres |
| Building Size | 10,000 sq. ft. |
| SDE (Cash Flow) | $360,000 |
| Implied Multiple | 12.5x SDE (Total) |
| Real Estate Value | $3,400,000 (75.5% of deal) |
| Business-Only Multiple | ~3.05x SDE |
The "Real Estate vs. Business" Reality Check
1. Strategic Asset Allocation
This is a real estate-heavy deal. $3.4M (75%) of your capital is tied to the land and building. You are not just buying a daycare; you are acquiring a physical asset. This reduces your risk because the land supports long-term appreciation. However, the business value ($1.1M) must still be validated by the local Seat Gap.
2. The Multiple: 12.5x vs. 3.0x
At first glance, a 12.5x multiple seems expensive. However, during due diligence, you must strip out the real estate. When you do, you are acquiring the daycare operations at 3.0x SDE.
The 3.0x SDE multiple for the business is only safe if the Addressable Seat Gap is positive. As we saw in Waxahachie’s ZIP 75167, a massive shortage allows for aggressive pricing. If the target were in an oversupplied zone like ZIP 76065, even a 2.0x multiple would be a risky investment.
👉 Try our free Daycare Valuation Tool to estimate your own deal value
3. Operator Fit: Who should buy this?
This deal is for investors prioritizing asset ownership. It is designed for those who want to control the "dirt" while scaling a multi-site operation. Given the $4.5M entry price, the new owner must have strong debt-service coverage. A 10,000 SF facility requires a robust management structure. It is not a "mom-and-pop" hobby; it is a high-leverage investment.
Deal Intelligence: Risk Snapshot
- Pricing Risk: Low–Moderate (Asset-backed by real estate)
- Capital Intensity: High (Requires significant upfront equity)
- Supply Risk: Medium (Watch for new brand expansions nearby)
- Expansion Risk: Uncertain (Subject to local zoning and licensing)
Deal Summary
A real estate-anchored acquisition where value is found in the land, not just current cash flow. This deal relies on long-term enrollment stability or future physical expansion to justify the 12.5x total multiple. It is best suited for buyers looking for a "forever site" in a high-demand Texas corridor.
Evaluate Your Daycare Acquisition & Site Strategy in Texas
A multi-million dollar deal shouldn't rely solely on the seller’s assumptions. Professional operators run the numbers against local seat gaps and the 18% occupancy redline to protect their survival margin.
Looking at a deal right now?
If you just need a quick sanity check, feel free to send me the location.
Not looking for an acquisition? If you prefer to enter the market via a new build-out or lease, compare the performance of the top US brands in our: 2026 Childcare Franchise ROI: Primrose vs. Goddard vs. Kiddie Academy>>
Disclaimer: The data, pricing, and specific development scenarios presented in this Waxahachie case study are aggregated for educational and illustrative purposes. This material does not constitute financial, legal, or investment advice.