Daycare Investment & Market Analysis: Katy, TX
- Audit Status: Available / Verified
- Last Reviewed: April 12th, 2026
- Data Freshness: March 2026 Licensing Update
Designed for use by buyers, lenders, and brokers during SBA underwriting
Data sources include ACS, Texas HHSC, public filings
Market Read: Affluent Growth, But a Closed Game
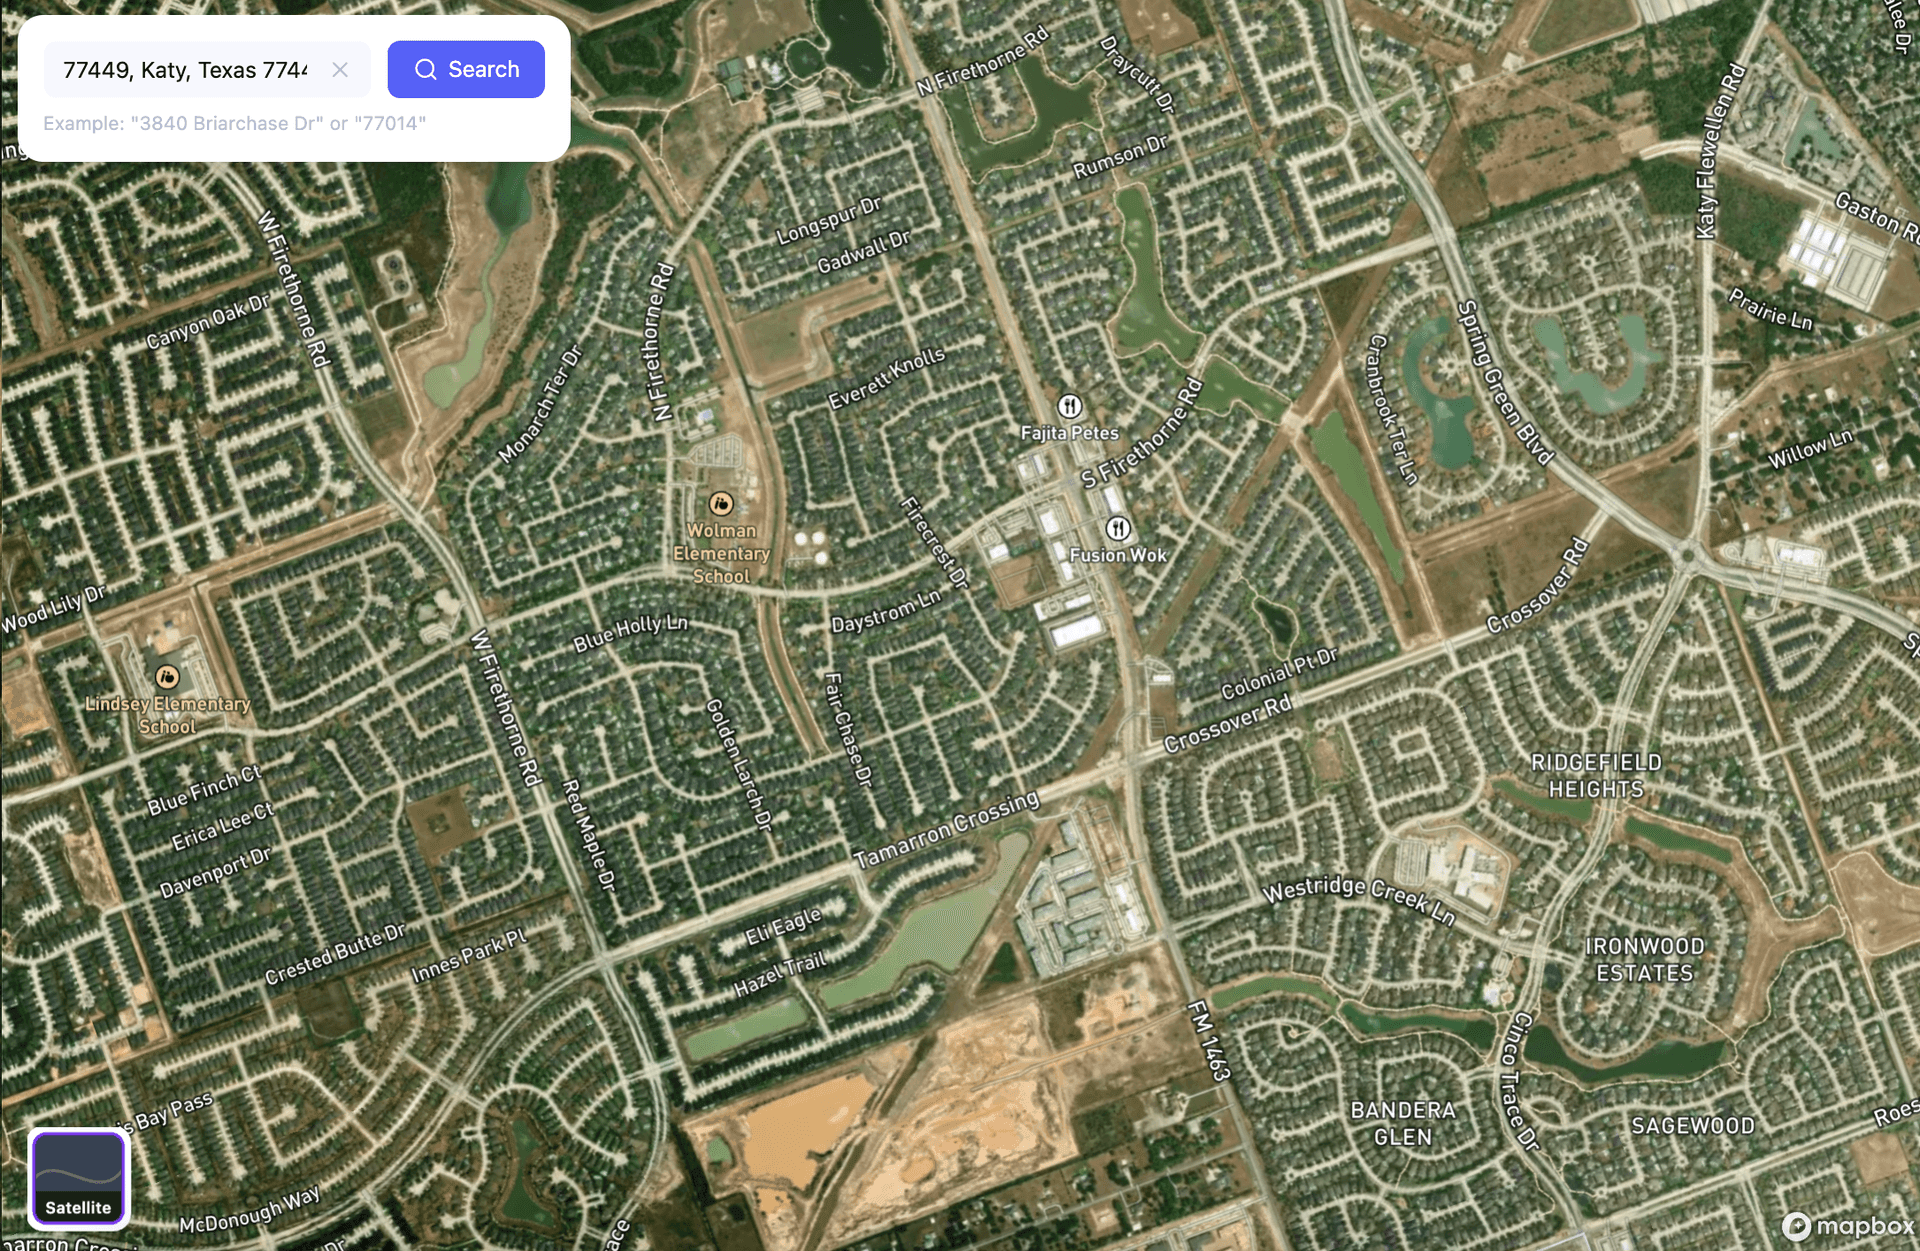
Zip 77494 anchors the Cinco Ranch corridor — one of the most affluent, family-dense submarkets in Greater Houston, with nearly half of households above the $150k threshold.
On the surface, the raw seat gap suggests a clear supply shortage.
But this is a statistical illusion.
Once adjusted for actual participation rates, informal care, and nanny substitution, the true addressable market is already over-absorbed — with an estimated negative seat gap exceeding 5,000 seats.
At the same time, the market is dominated by institutional-scale operators — including Kids 'R' Kids, Primrose, and Goddard — running 150–300 seat campuses with strong brand-driven enrollment pipelines.
The result is not a “growth market,” but a fully allocated premium market.
New entry is no longer about capturing unmet demand — it is about stealing share from established operators.
In this environment, success depends less on demographics, and more on:
precise micro-location within a 10-minute catchment
aggressive enrollment ramp velocity
and brand-positioning alignment with local tuition ceilings
This is a high-income market with low margin for strategic error.

Deal Read: You're Not Buying a Business — You're Buying a Defensive Position
1. The Illusion of Cash Flow (Listings A & B)
At first glance, both franchise deals appear attractively priced:
- Listing A: 1.25x SDE
- Listing B: 1.54x SDE
But this is not a distressed multiple. This is a market-adjusted multiple in a saturated premium corridor. Because in Zip 77494, cash flow is not driven by unmet demand — it is driven by defended enrollment share.
You are not buying growth.
You are buying position stability inside a closed system.
2. Real Estate Is the Deal — Not the Daycare
Across all three listings:
- 80%–87% of total price is real estate
- Business value is compressed to ~1.2x–1.5x SDE
This tells you everything: The market is not paying for upside. The market is pricing in survival + asset backing.
Why? Because:
- Entry is bottlenecked (site scarcity + permitting + build cost)
- Demand is already allocated across incumbents
- New supply = immediate share war
So buyers anchor on land, not operations.
3. The Micro-Market Collision: Same Demand, Different Outcomes
All three deals sit within overlapping 10–15 minute catchments. But ExpansionPoint data shows:
- 77494 → Severely over-allocated (−5,000 seats)
- 77449 → High raw gap, but price-sensitive ceiling
- 77493 → Balanced, but not premium-aligned
This creates a structural tension:
- Premium assets rely on high-income enrollment pools
- But those pools are already fully distributed
So performance divergence comes down to:
- exact micro-location
- brand pull
- enrollment velocity
Not “market growth”
4. The Real Risk: You're Underwriting the Wrong Variable
Most buyers underwrite:
- population growth
- household income
- historical revenue
But in Katy, those are already priced in. The real variable is: How much share can you realistically take — without breaking tuition or occupancy?
Because in a closed premium market: One new competitor doesn't expand demand — It redistributes it.
How This Snapshot Is Used in Deals
This snapshot helps anchor pricing conversations and reduce information asymmetry during the deal process.
It is most useful when:
- Buyers need to validate location depth before committing capital.
- Lenders require independent saturation risk assessment for SBA underwriting.
- Franchise committees demand third-party market validation.
- Price negotiations stall over real estate vs. business value.
Disclaimer: This is a data-driven market reference designed to facilitate objective underwriting, not financial advice.

When deeper questions come up
When the snapshot isn’t enough, a Site Report helps clarify:
- Whether there is real, addressable demand to support enrollment — or if the market only looks fine on paper
- Where capacity pressure actually exists, and where it doesn’t, across the surrounding zip codes families realistically choose from
- Whether nearby providers — centers, home-based care, and nannies — are already absorbing demand before it reaches the market
- How drive-time patterns and household profiles shape who would realistically enroll
- Early market signals (recent openings and closures) that may impact enrollment stability over the next 12–24 months
Don't sign a $5M+ LOI in Katy based on raw demographics. Let's stress-test the actual addressable gap before you commit.